Global Programs Tanzania
Enhancing HIV program data quality, fostering data-driven
decision-making, and strengthening capacity through training,
technical assistance, and mentorship for
local partners
and the health ministry in Tanzania.
Projects counter
Dashboards
Applications
Projects view
Our Popular Projects
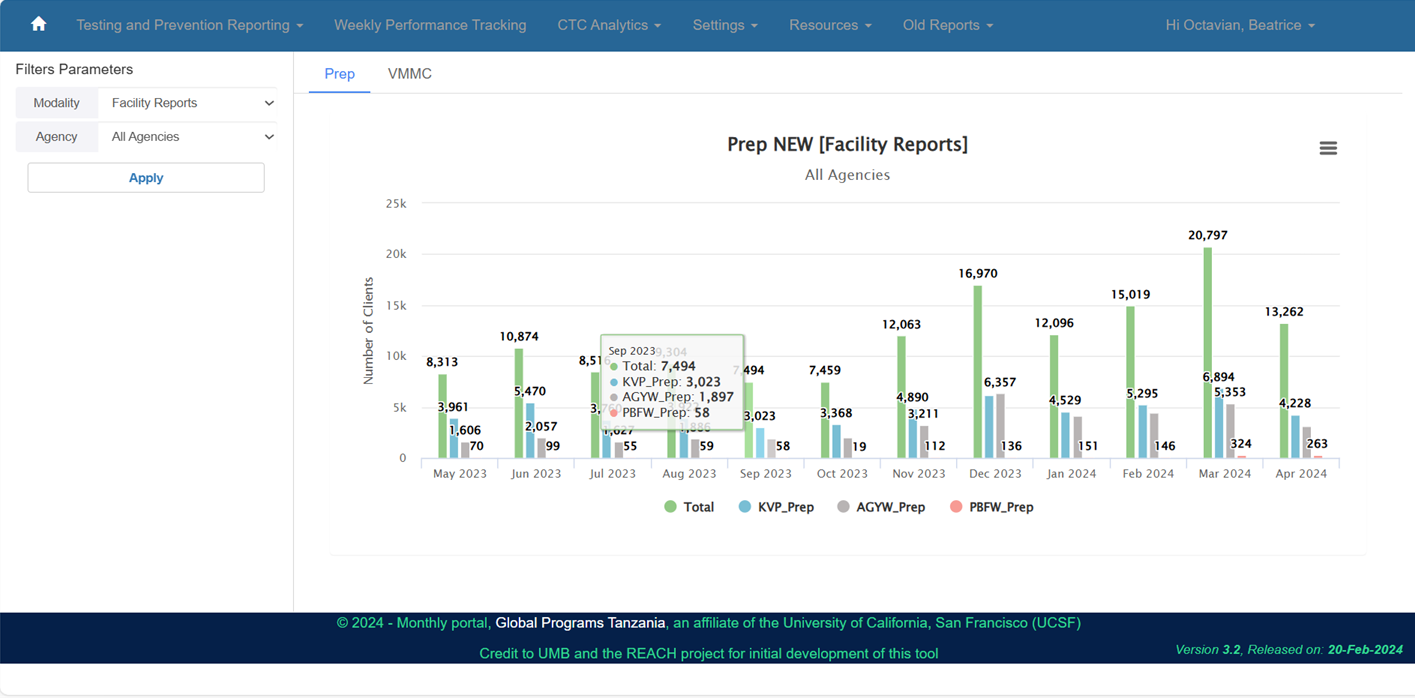
Monthly Portal
Is a powerful reporting tool for PEPFAR Implementing Partners (IPs). It allows stakeholders to monitor key HIV-related indicators progress, analyze program achievements, identify data quality issues, and prioritize facilities needing technical assistance. Empower your team with actionable insights and drive impactful changes in HIV program management. Click to read more
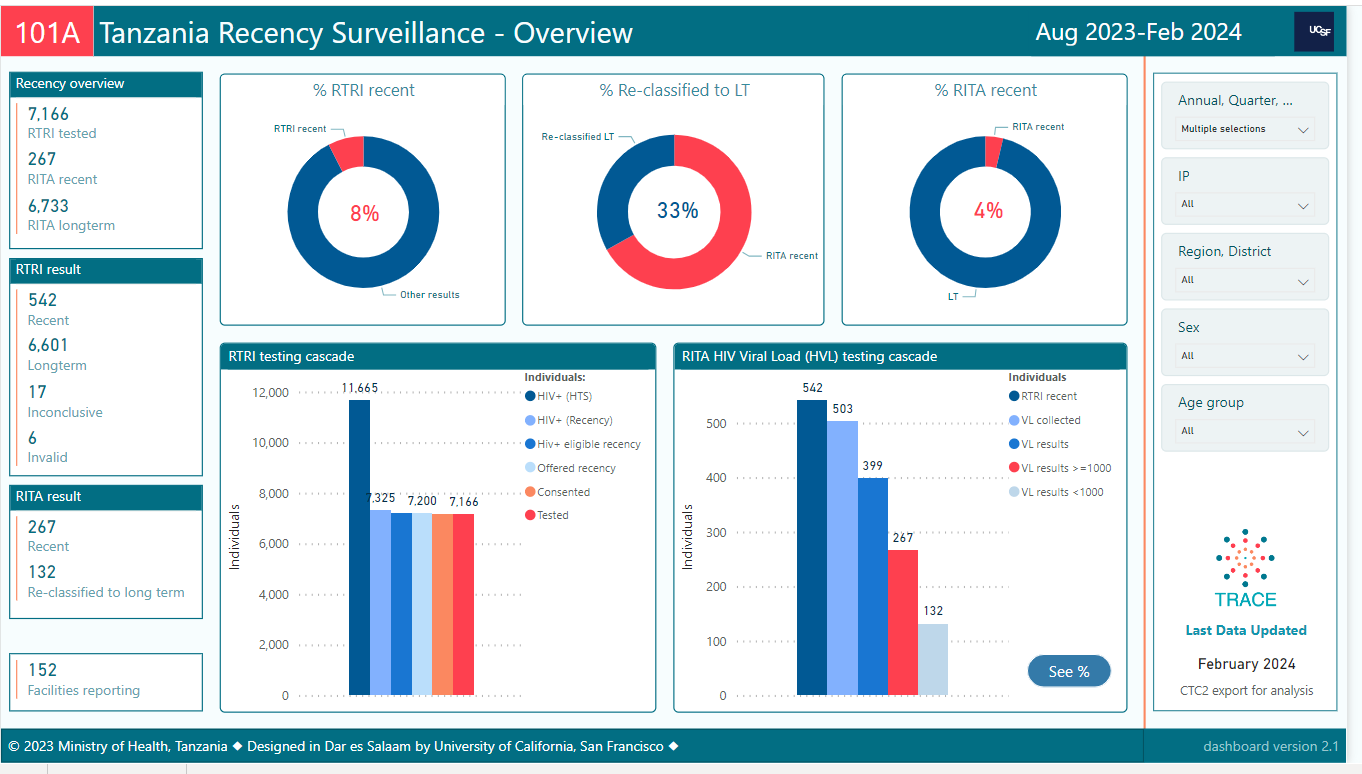
HIV Recency Surveillance Dashboard
Discover the power of our HIV Recency Platform, an innovative tool designed to revolutionize HIV prevention and control. This platform offers real-time insights into new HIV infections and testing method. The data collected will help to identify the ongoing HIV transmission and guide improvements in prevention, care, and treatment services. Click to read more
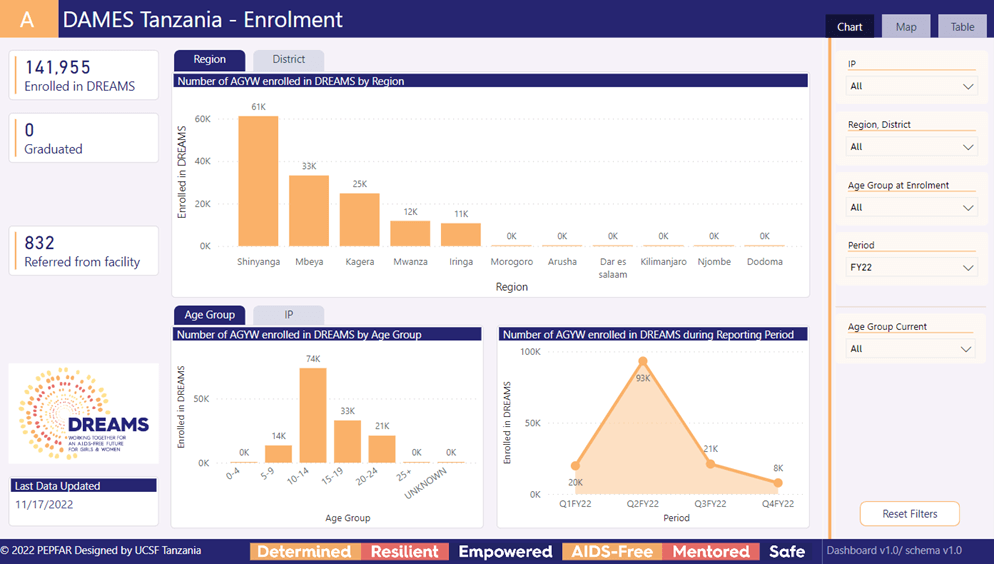
DAMES Dashboard
Experience the power of integrated data with the DAMES Dashboard. Originally developed to consolidate individual-level data, this tool highlights the layering effect of the multiple services being provided to individual DREAMS beneficiaries. The dashboard showcases data from all DREAMS community partners, offering both individual and aggregate views. Gain valuable insights, track progress, and see the holistic effect of your interventions with the DAMES Dashboard. Click to read more
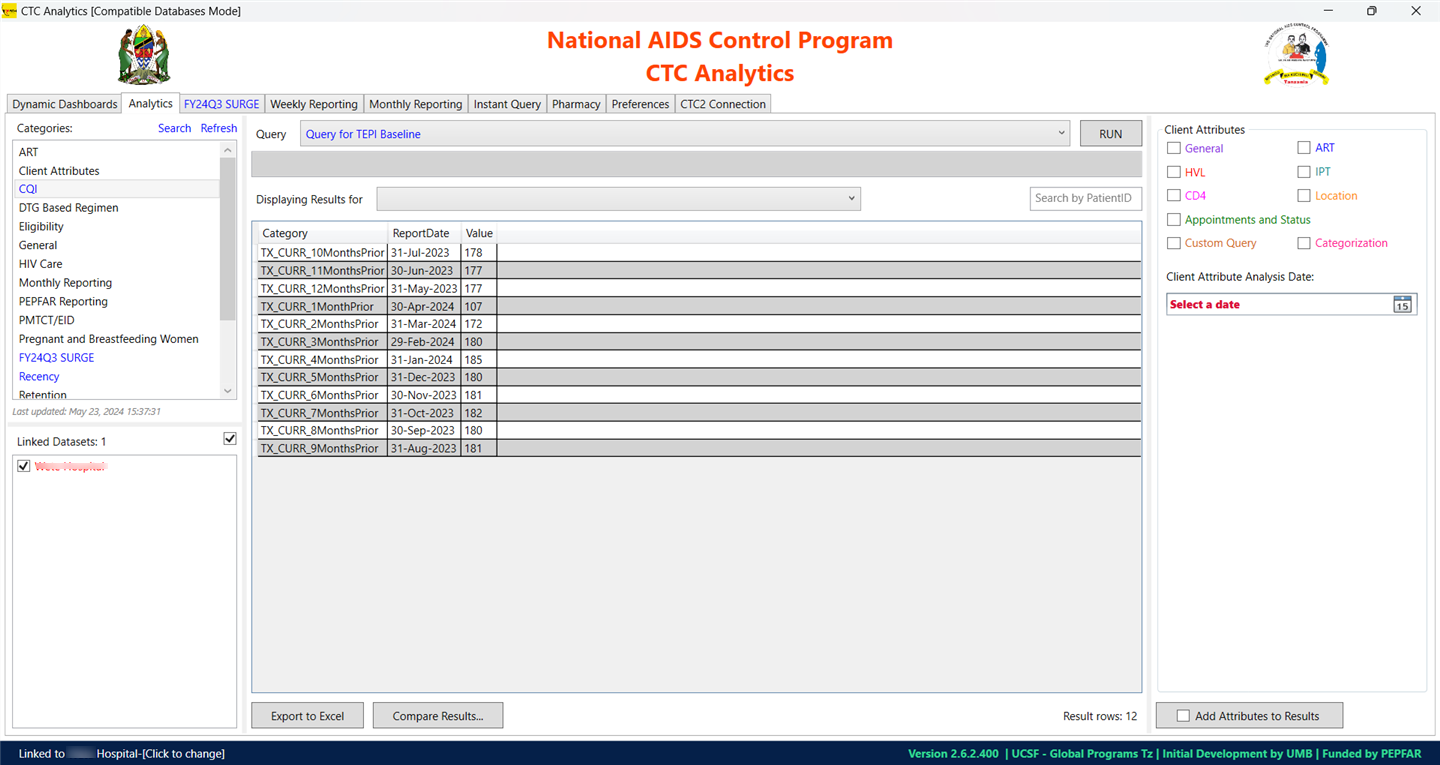
CTC Analytics
Enhance your HIV service delivery with CTC Analytics, the perfect complement to the CTC2 database. By utilizing the Export for Analysis data file, CTC Analytics offers detailed insights into priority indicators, promoting data-driven decisions and improved outcomes at the facility level. Elevate your data analysis capabilities and optimize your HIV services with CTC Analytics. Click to read more
Version 2.6.8
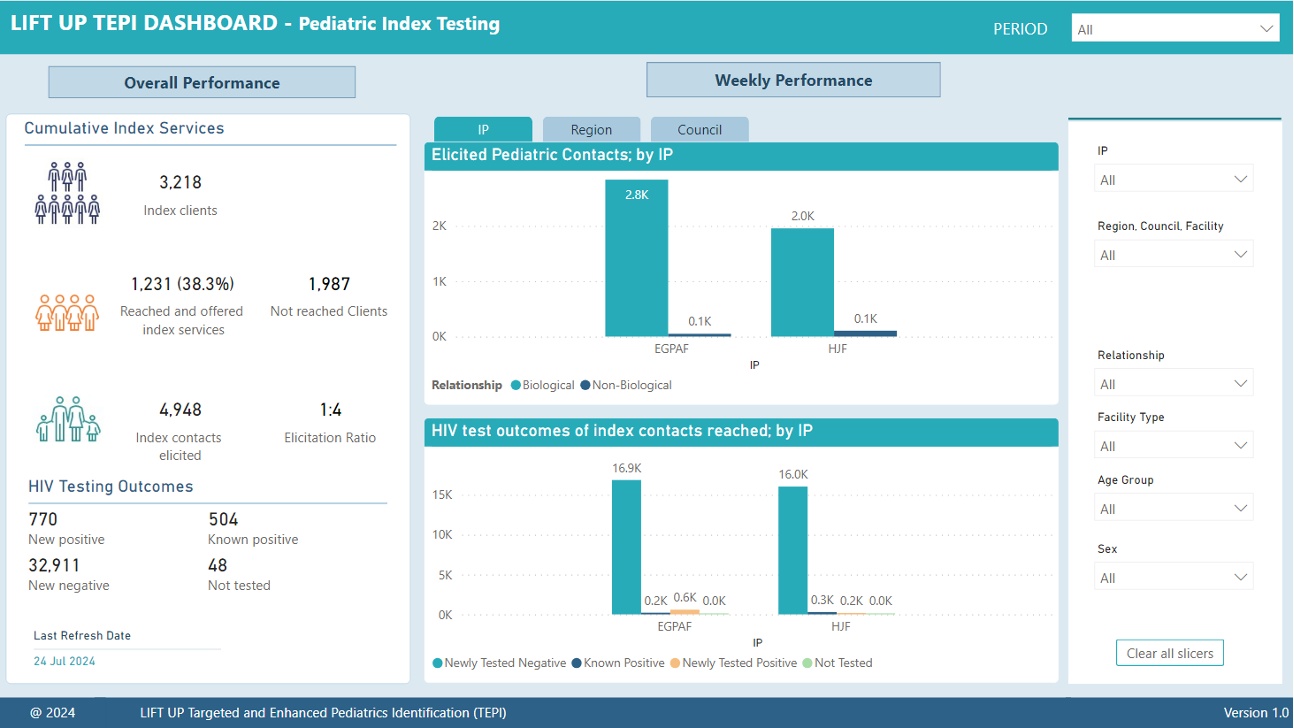
TEPI Dashboard
The TEPI (Tracking and Enhancing Pediatric Identification) Dashboard is a crucial tool designed to support the integrated, collaborative efforts of PEPFAR Tanzania and its Implementing Partners (IPs).. in their mission to improve identification of children living with HIV. This weekly dashboard enables stakeholders to monitor, evaluate, and enhance the performance of pediatric identification initiatives through near-real-time data analysis. Click to read more
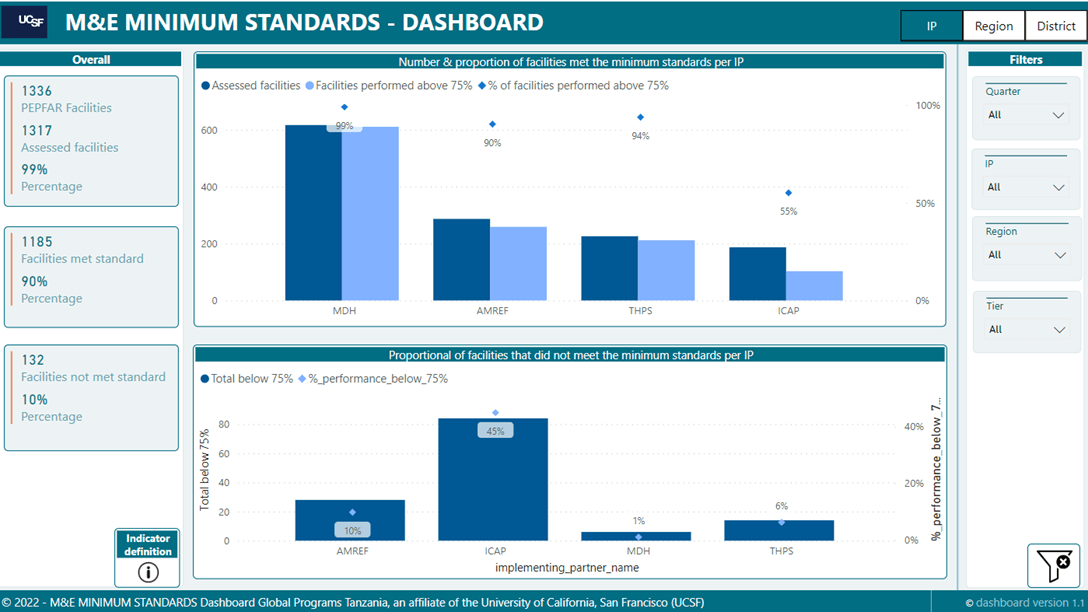
M&E Minimum Standards Dashboard
Ensure the highest quality data with the M&E Minimum Standards Dashboard. This essential tool tracks the implementation and maintenance of facility-level data quality standards, guaranteeing the availability of accurate and reliable data to support comprehensive HIV care and treatment. Elevate your data management practices and enhance the effectiveness of your HIV programs with the M&E Minimum Standards Dashboard. Click to read more
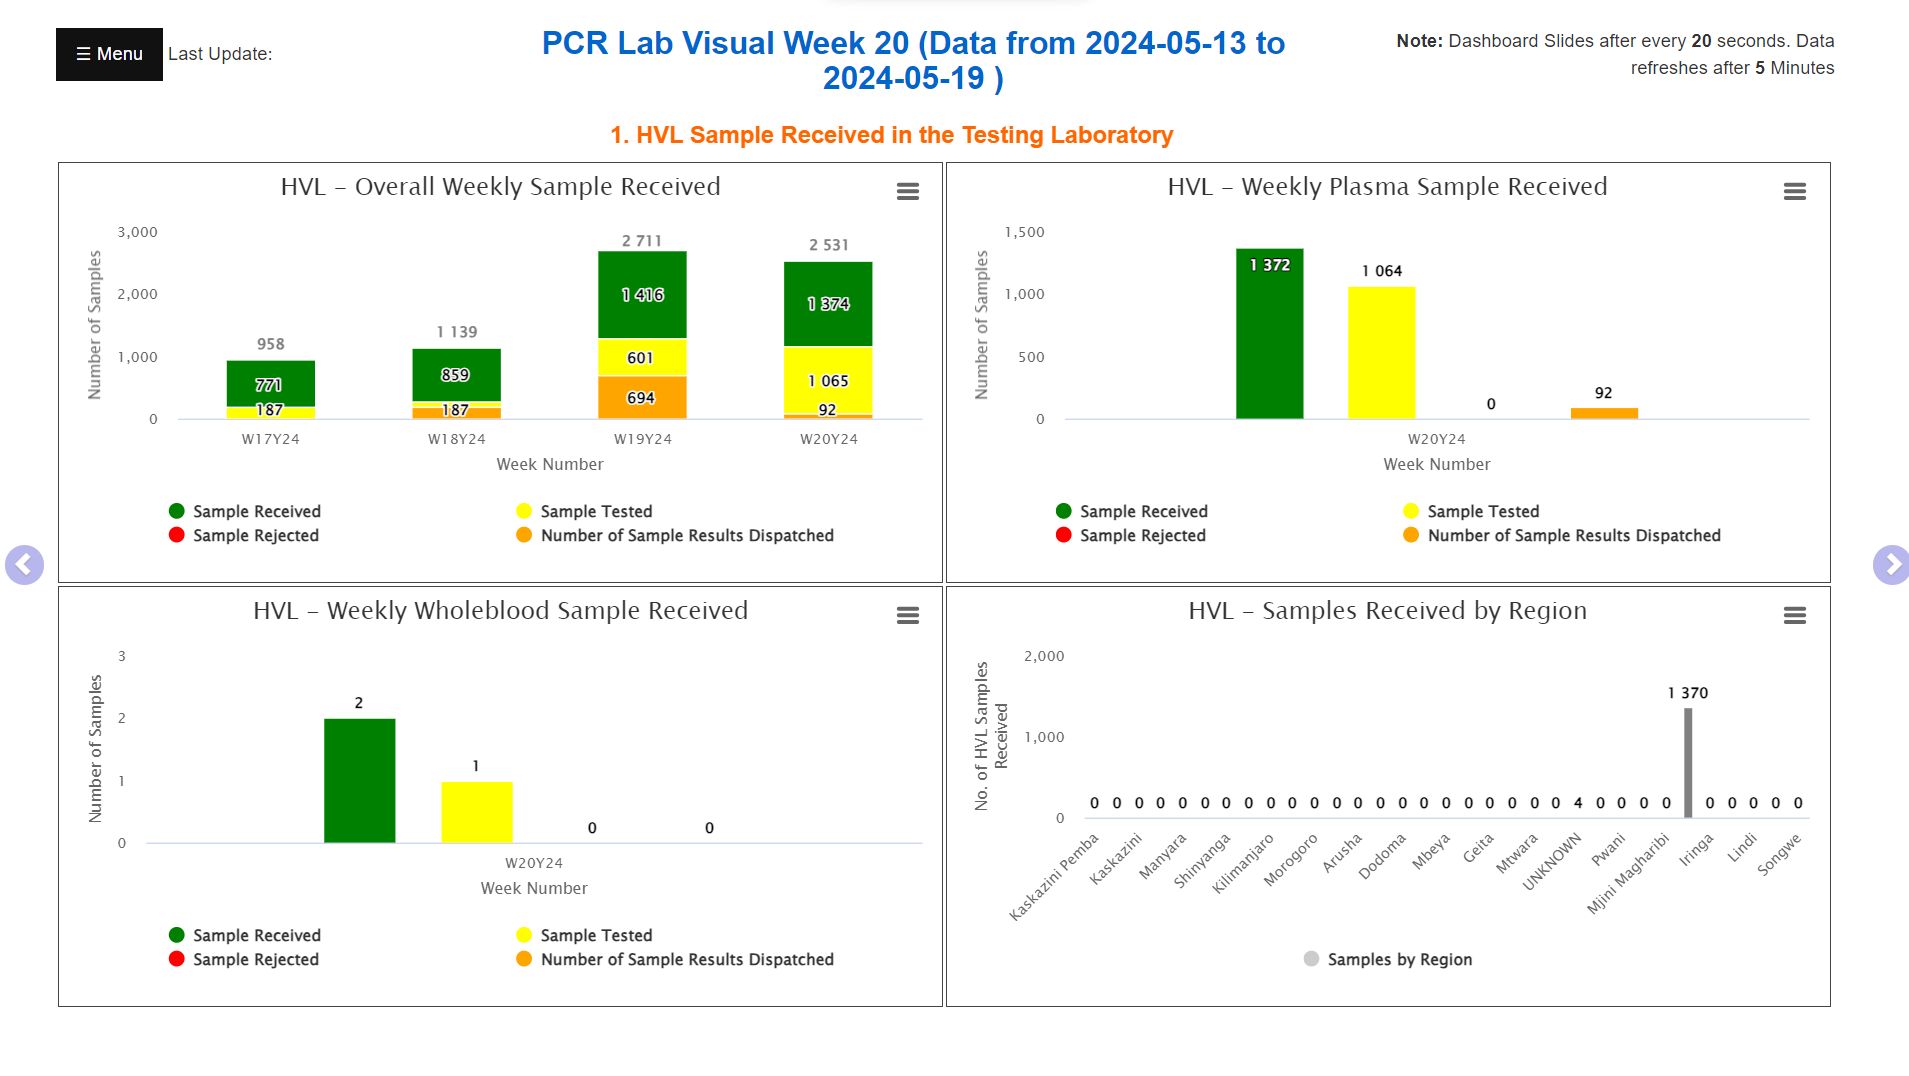
Lab Visual
This web application dashboard, used within PCR laboratories, visualizes weekly trends in sample data, machine performance, and report generation. Empowers lab managers with insightful and actionable data through Lab Visual. Click to read more
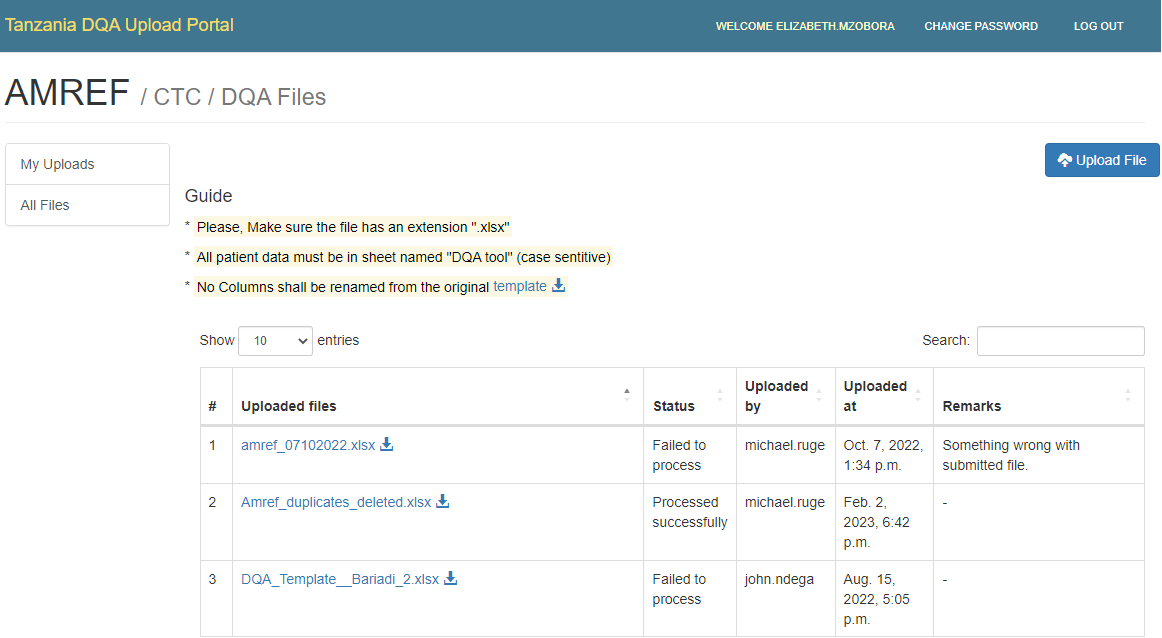
Data Quality Upload Portal
The DQA Upload Portal is your gateway to streamlined management of ART (Antiretroviral Therapy) patient counts across all PEPFAR-supported facilities. This dynamic web-based system serves as a central repository for DQA (Data Quality Assessment) tools, ensuring accurate and up-to-date information for effective decision-making. Join us in revolutionizing data quality assurance and optimizing patient care with the DQA Upload Portal. Click to read more
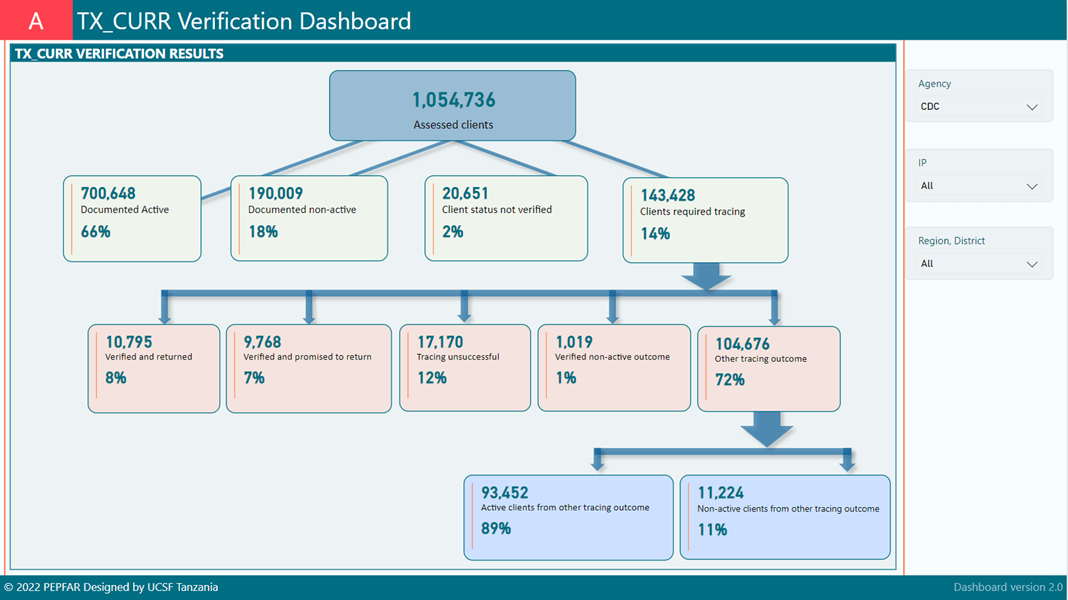
TX_CURR Verification Dashboard
Step into the heart of data accuracy with the TX_CURR Verification Dashboard. This dynamic tool showcases the results of a comprehensive data quality exercise, meticulously verifying the number of adults and children currently receiving life-saving antiretroviral therapy (TX_CURR) across all PEPFAR- supported facilities. Welcome to the journey of transparency and accountability as we ensure accurate data for effective HIV treatment and care. Click to read more
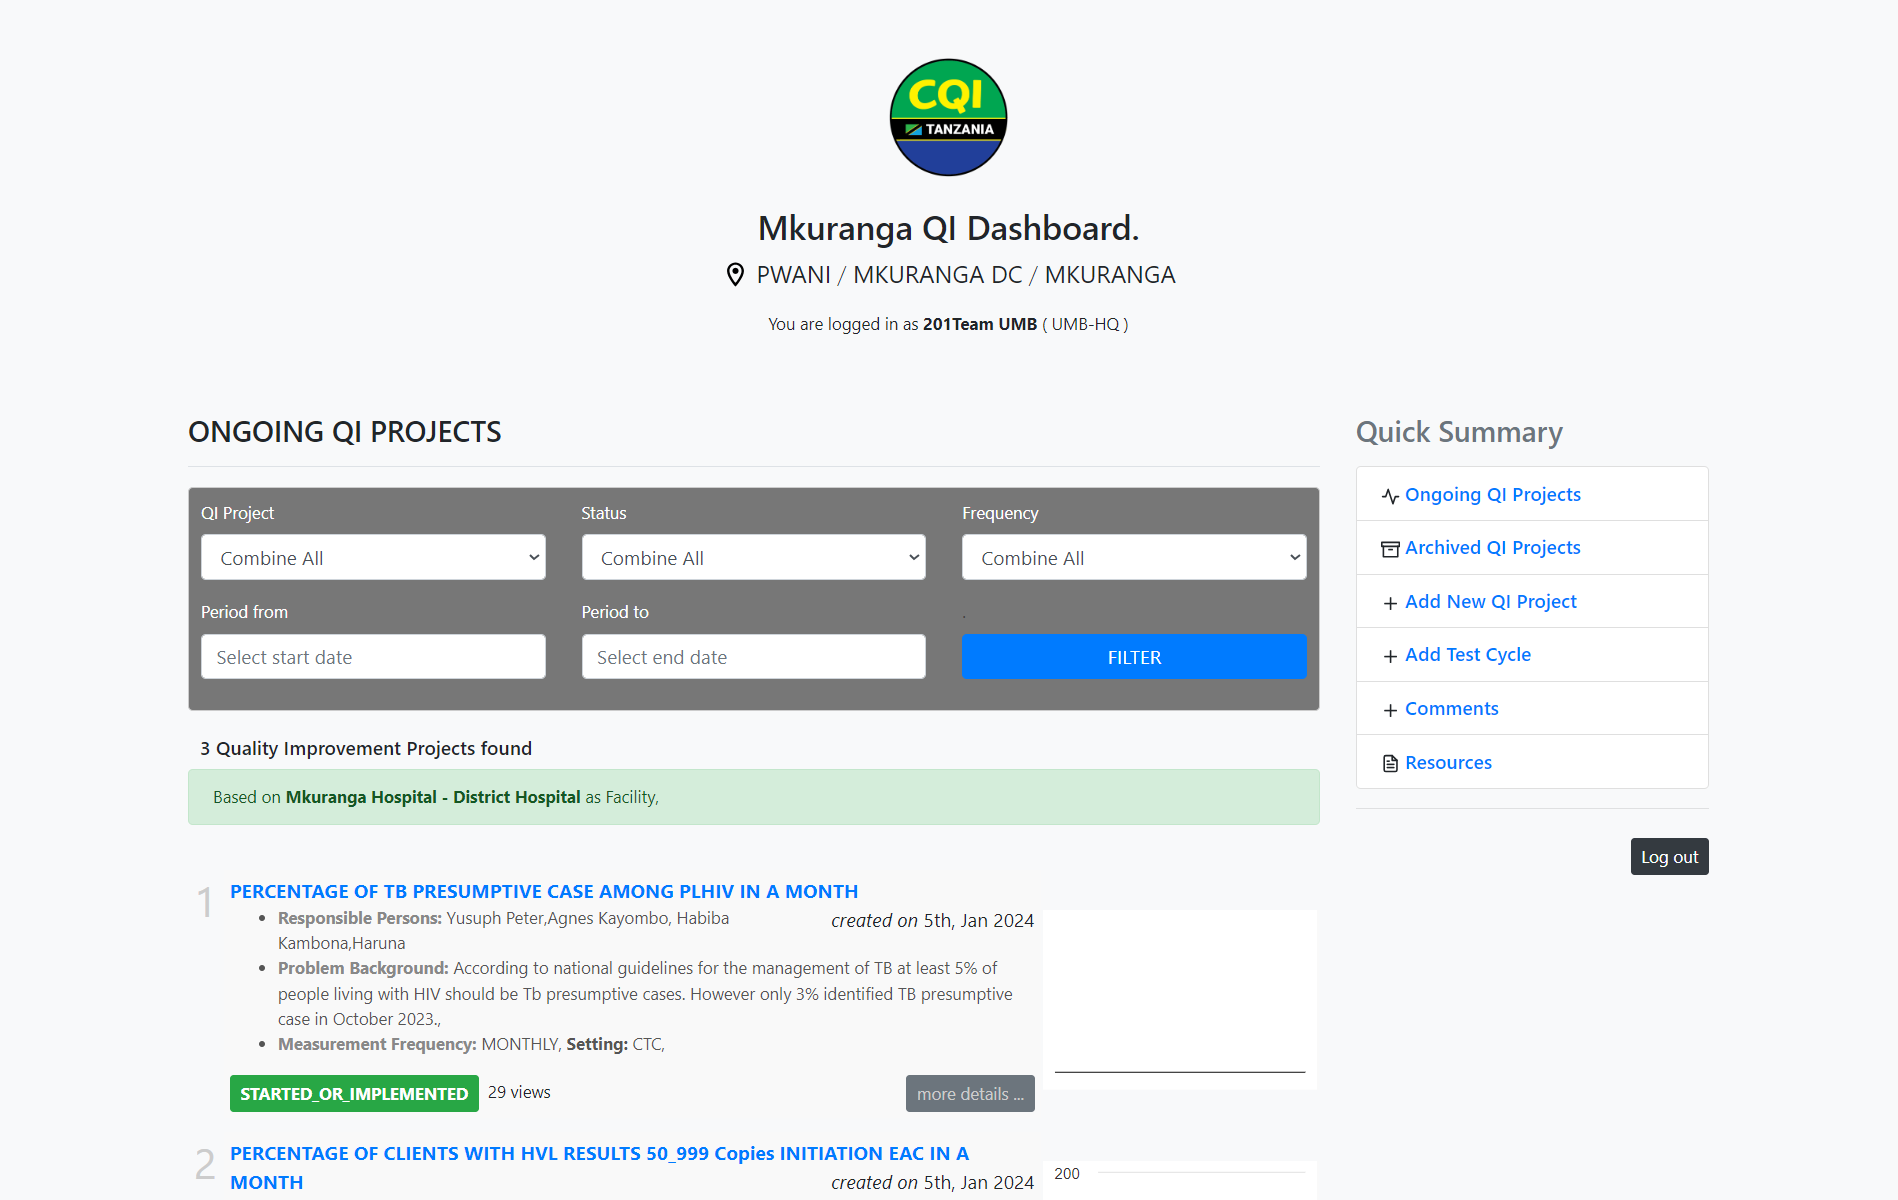
CQI Dashboard
The CQI Dashboard is the window into transformative Continuous Quality Improvement (CQI) activities, designed to amplify the impact of your efforts. Complementing the CQI Application, this dynamic dashboard empowers Implementing Partners to effortlessly view and analyze CQI activities across supported facilities. Dive into data-driven insights, unlock new possibilities, and drive meaningful change with the CQI Dashboard. Click to read more
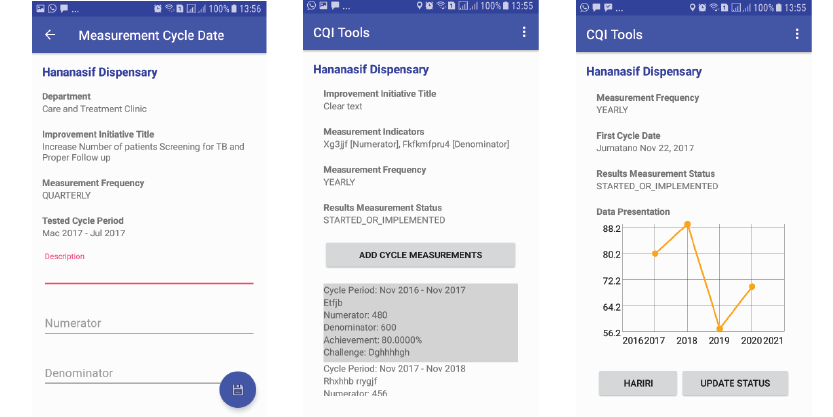
CQI Application
This is a dynamic tool for driving Continuous Quality Improvement (CQI) straight from a mobile device. Designed for facility staff, this innovative app empowers users to effortlessly register and track CQI activities and achievements on the go. Seamlessly integrate quality improvement into your daily routine and watch as your efforts lead to tangible improvements in healthcare delivery. Click to read more
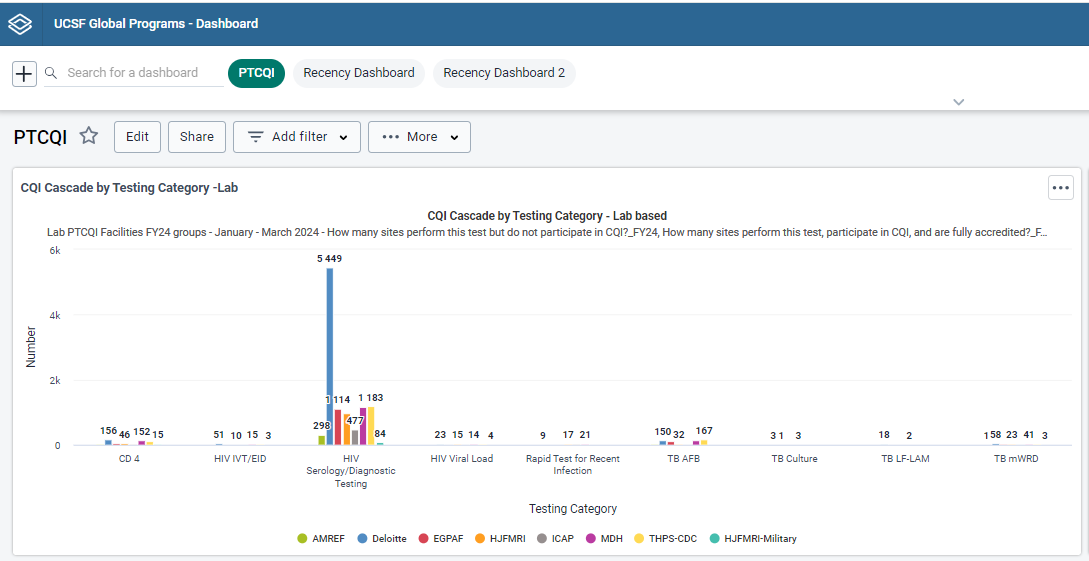
Lab PTCQI
Step into the future of laboratory quality improvement with the Lab-PTCQI System. This creative web-based platform features user-friendly interfaces designed to streamline reporting, analysis, and utilization of Lab CQI (Continuous Quality Improvement) indicators. Used by Implementing Partners (IP's), the Lab- PTCQI System makes it a breeze for IP staff to enter data quarterly, ensuring timely and informed decision-making to enhance laboratory services. Click to read more

IQSMS Dashboard
Enhance your data management with the IQSMS Dashboard. Complementing the IQSMS Android App, this web-based tool offers facility staff a convenient data entry option, along with built-in visualizations and analysis of key indicators. Stay informed and make data-driven decisions effortlessly with the IQSMS Dashboard. Click to read more
IQSMS Android Application
This essential tool gives Implementing Partners (IP's) near real-time access to facility-level data for swift analysis and course correction. Perfect for collecting weekly data from health facilities. IQSMS enables IP's to track the program progress of key performance indicators efficiently. Stay ahead with IQSMS. Click to read more
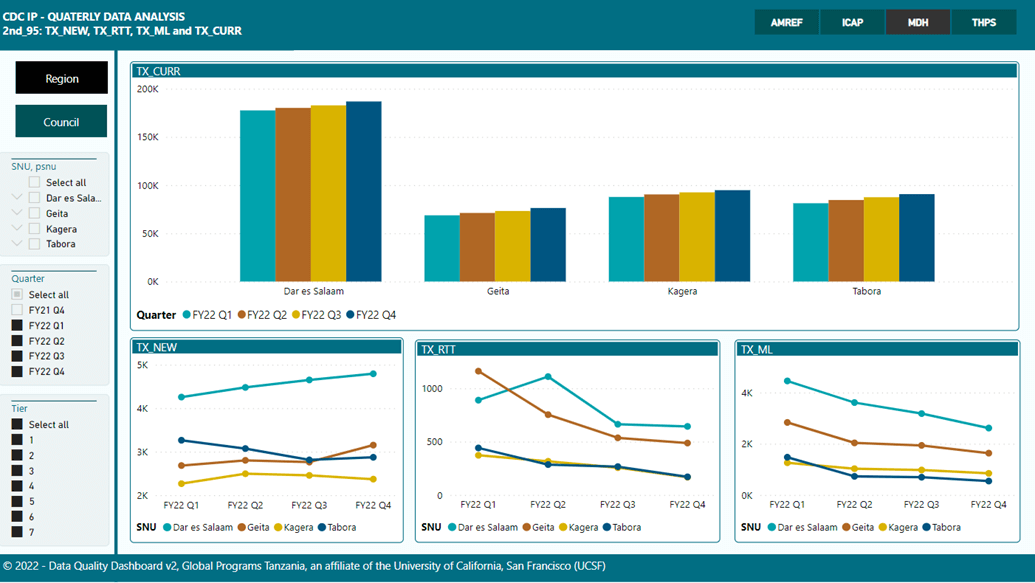
Data Quality Quarterly Dashboard
Stay tuned with the Data Quality Quarterly Dashboard, your go-to tool for visualizing quarterly trends in indicator performance and data quality using data submitted by the CDC-supported Implementing Partners(IP's) into Data for Accountability Transparency and Impact (DATIM). This dashboard provides a clear and comprehensive view of data submitted, highlighting performance and data quality issues empowering IP's to make informed decisions and drive impactful results. Click to read more
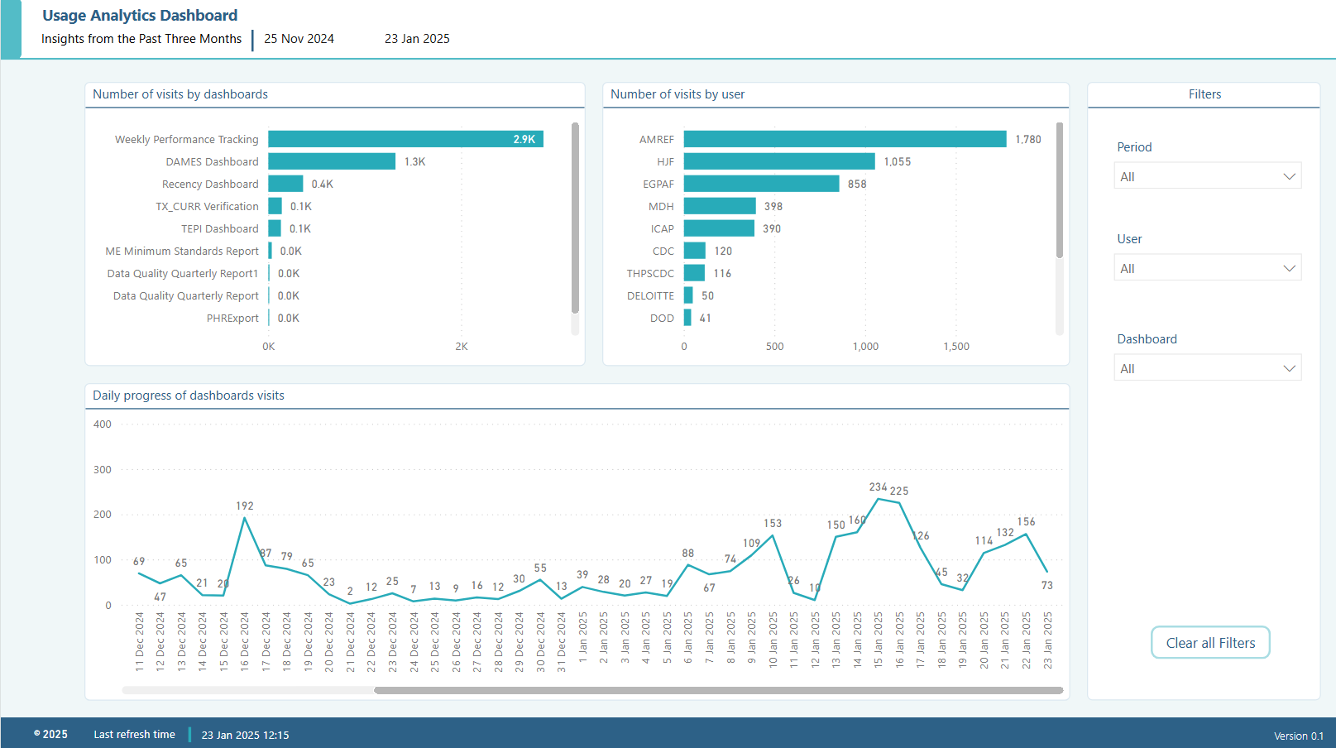
Usage Analytics Dashboard
This dashboard is an analytics tool designed to provide insights into using various dashboards/reports across different implementing partners and other stakeholders. The coverage captures the number of visits for the last three months, showcasing user interest, visit trends, and frequency of user engagement. Click to read more


